Virtual Observatory
TL;DR
Background
Used to display measurements from radiosondes, satellites and simulations. These measurements can be viewed as a time series, filtered, displayed, and compared on graphs. I took part in this project as a front-end developer.
This project is created for the GAIA-CLIM project.
Front-end
The front-end is built using Vue.js and Vuex. Visualizing data was done using Plotly.js which was integrated with Vue.js.
This application is very data-intensive since its main purpose is to fetch and display information about all sorts of different measurements. Vuex is used to manipulate and store all this data. There is a lot of information required to be displayed on plots and different information is required at different times.
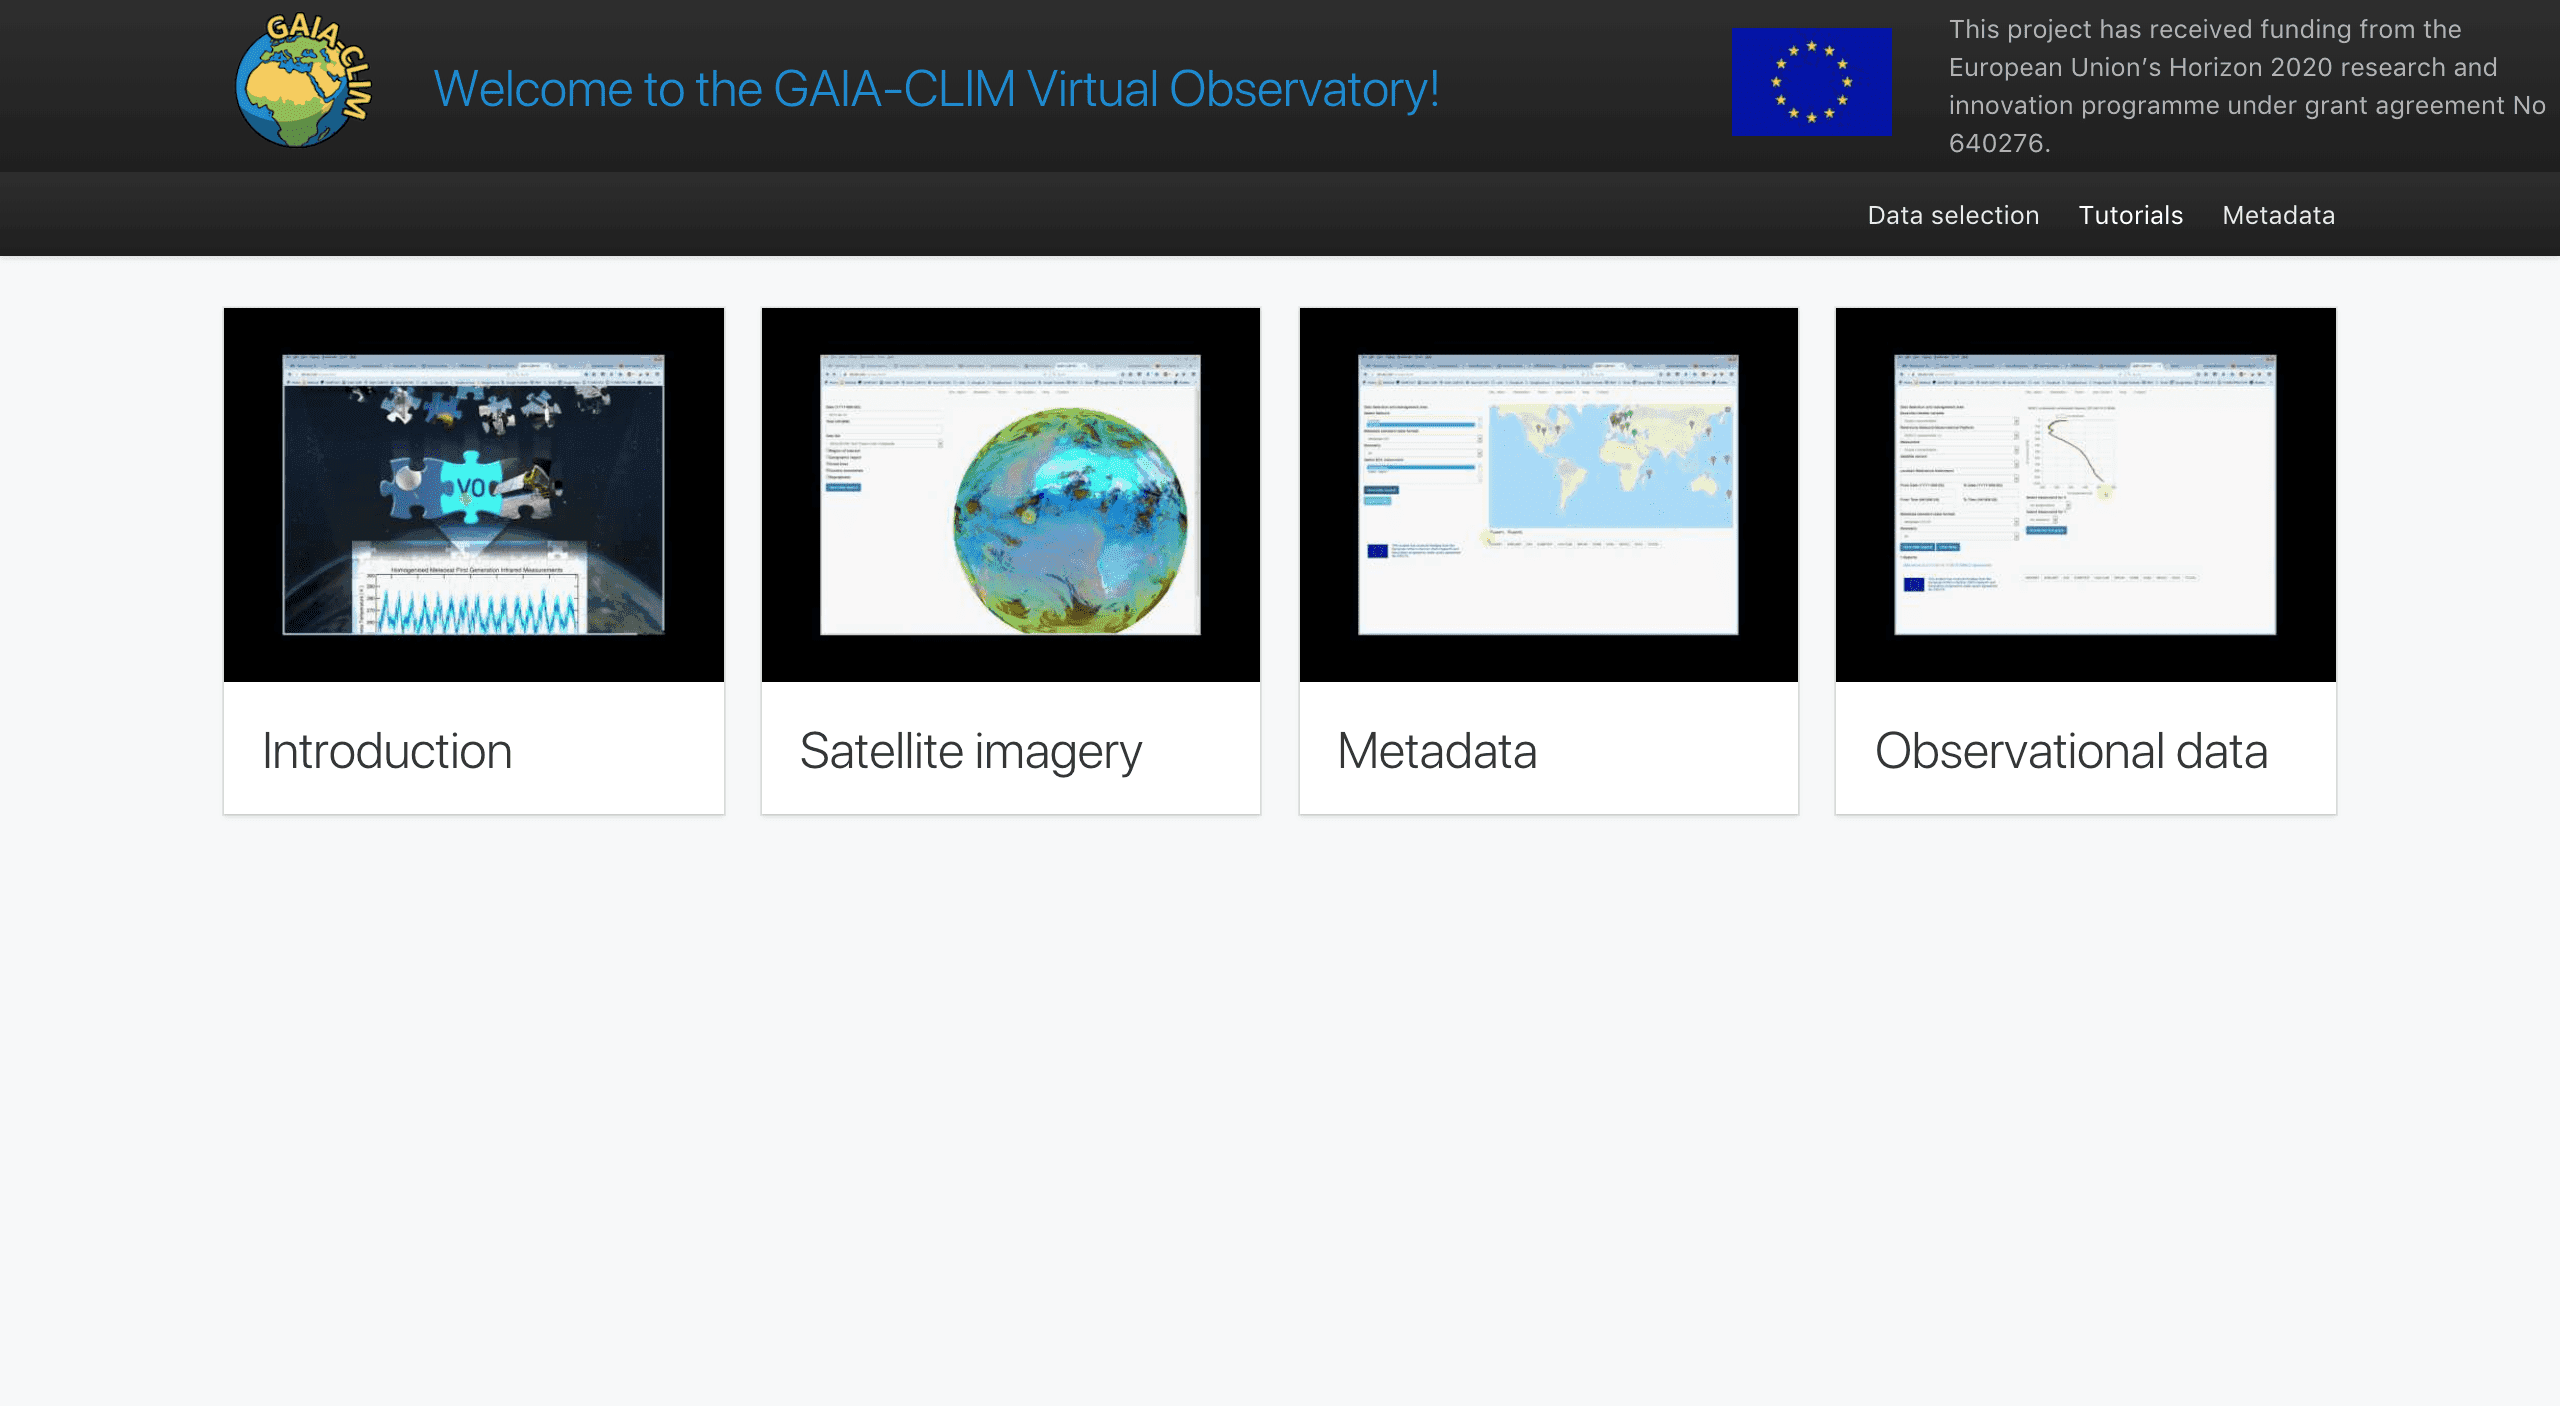
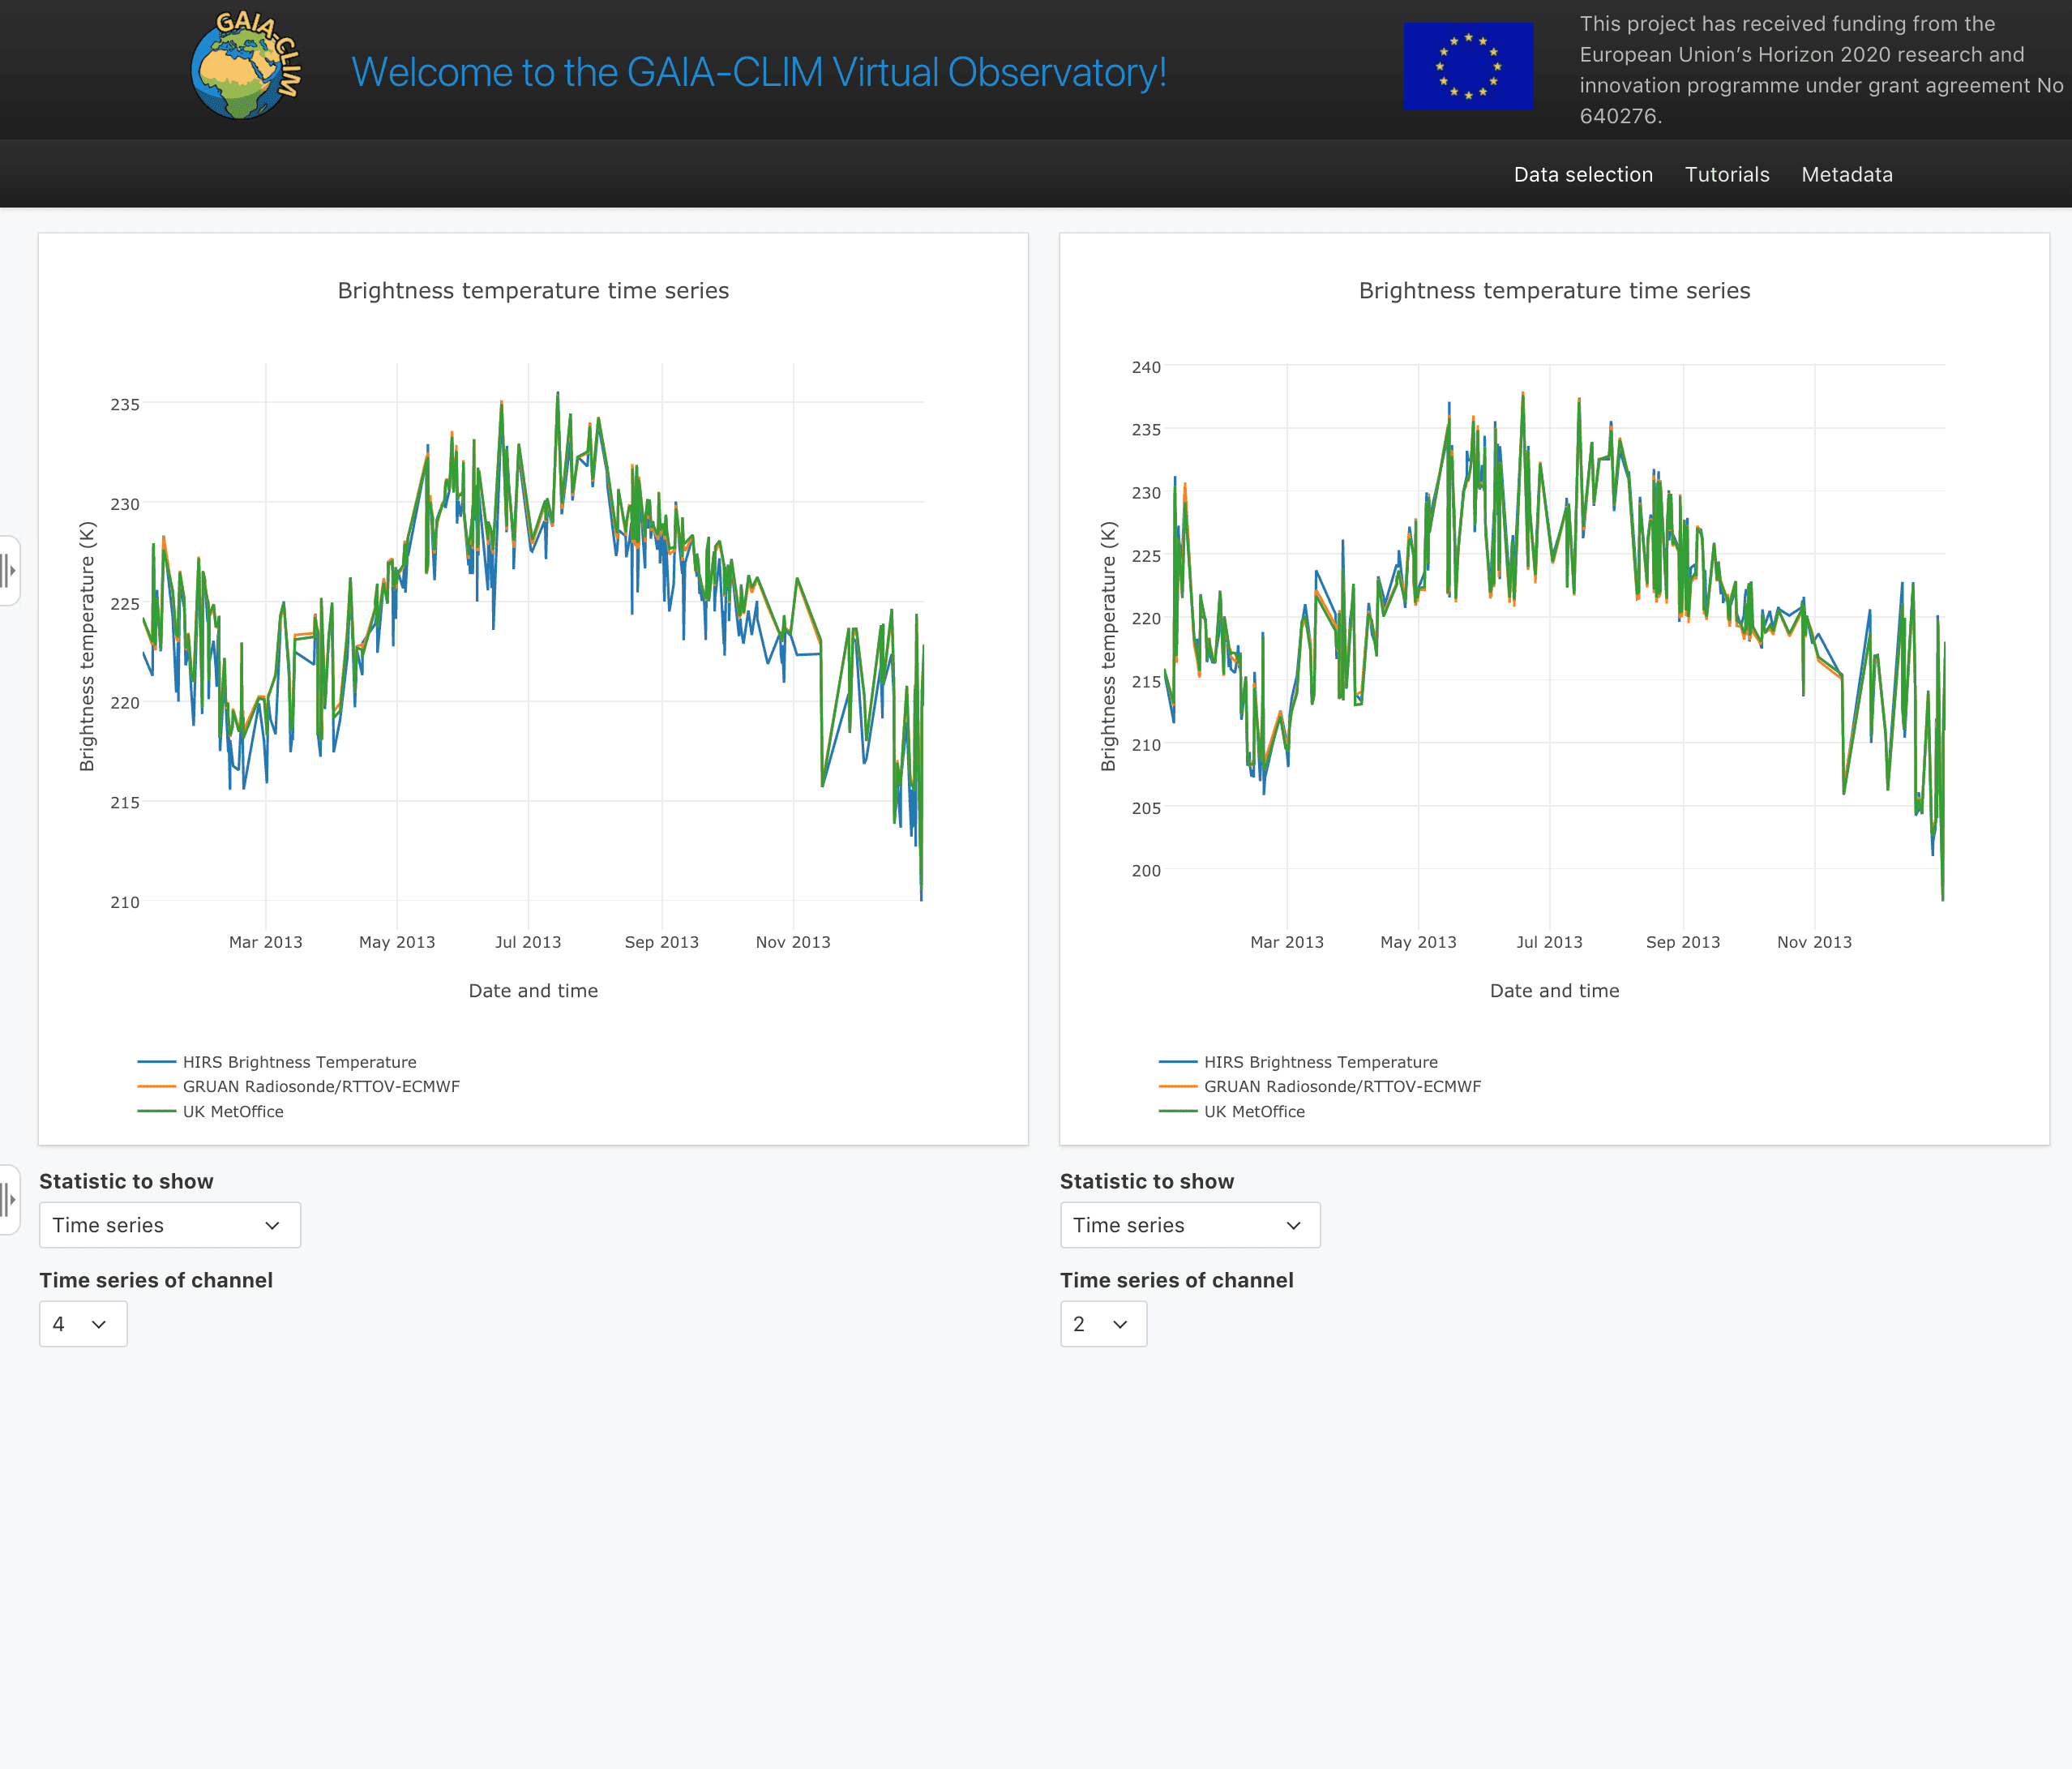
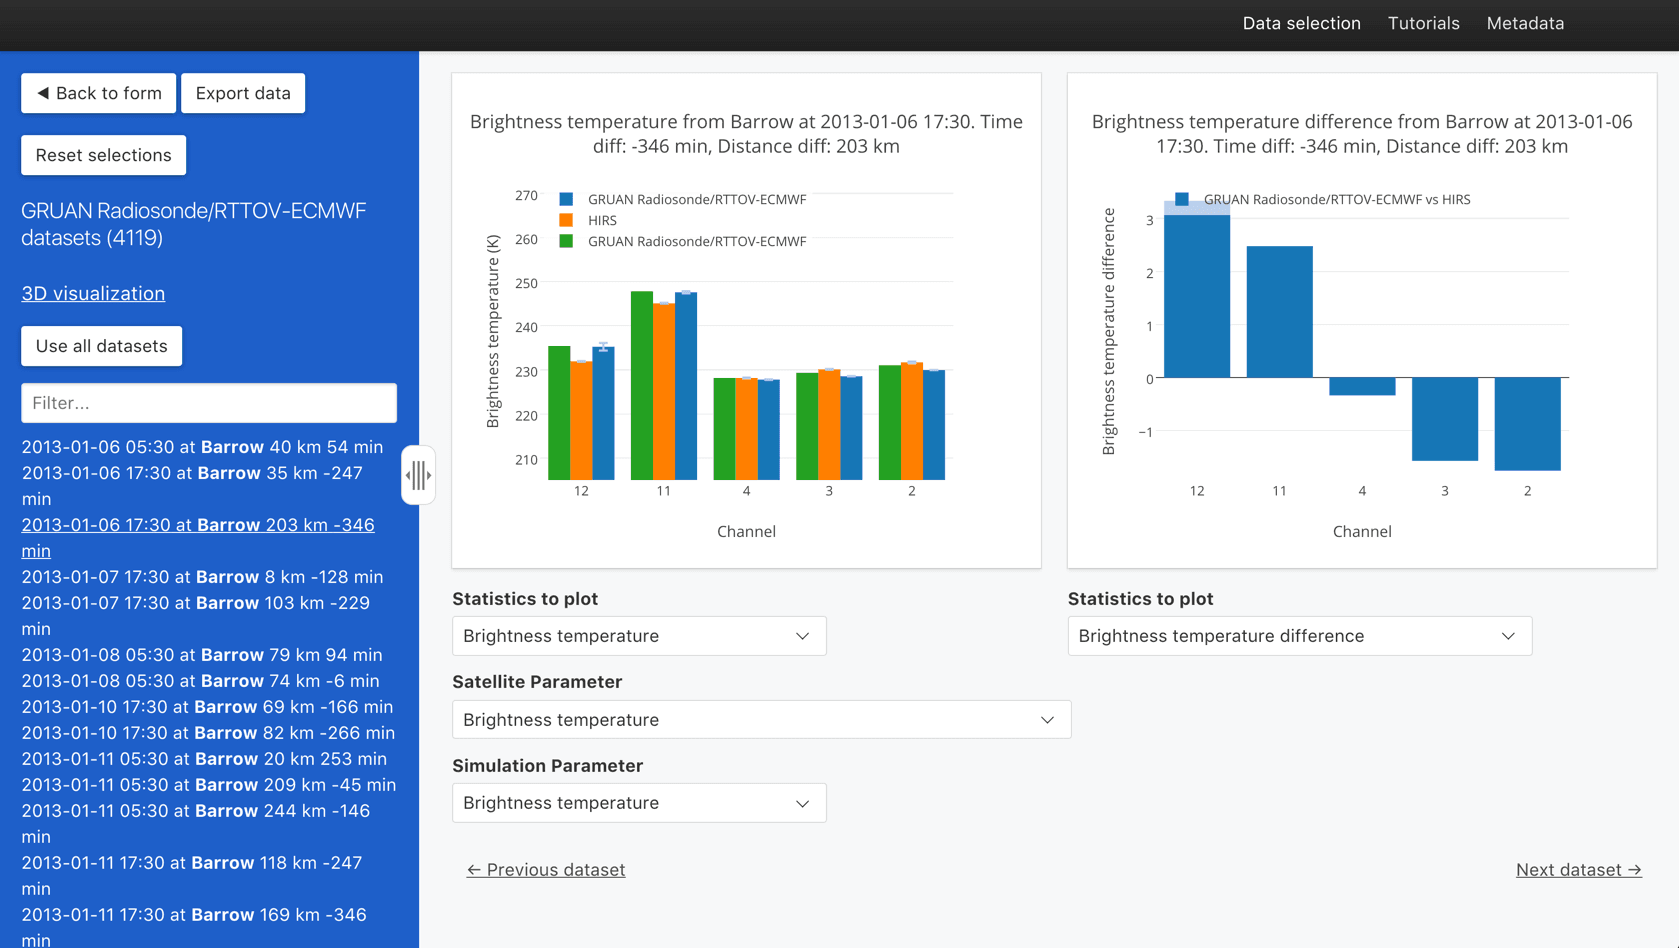
Screenshots